People wait in line to vote at a polling site at Public School 261 on Nov. 8, 2016 in New York City. (Photo by Drew Angerer/Getty Images)
Many lament the relatively low turnout of our fellow Americans on Election Day, but over the long term, we have been getting better, as the figure below shows.
As different segments of the American population gained the right to vote throughout our history, the percentage of voters as compared to population increased. The first surge came in 1828, when non-property-owning white men gained the right to vote. Then we see another surge, when women got the right to vote in 1920.
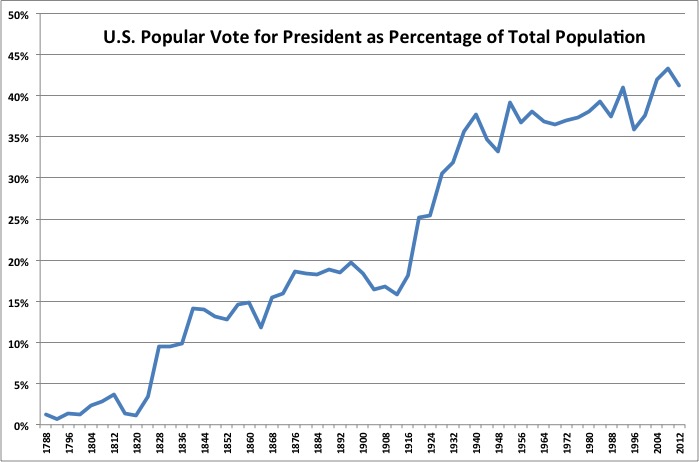
Source: Wikipedia/
CC BY-SA 3.0
In some ways, we’ve come a very long way. In 2016, the electorate is expected to be the most diverse ever, as nearly 1 in 3 eligible voters on Election Day will be Hispanic, black, Asian or another racial or ethnic minority. That’s up up from 29 percent in 2012.
But in other ways, we’re stagnating. If you don’t like any of the candidates running for president today, you can blame over 70 percent of your fellow Americans. That’s because just 28.5 percent of estimated eligible voters cast a ballot in the 2016 Republican and Democratic primaries.
While a record number of Americans have voted ahead of Election Day, with at least 46.27 million people casting ballots by early voting, according to Associated Press data, voter turnout in America is notoriously dismal compared to other developed countries.
In August, Pew Research ranked the US 31 out of 35 countries on voter turnout based on the voting age population among nations that are part of the Organization for Economic Cooperation and Development.
Voting in America
-
- Number of Americans registered to vote in 2016: 200 million
- Estimated number of voting-age Americans who won’t cast a ballot: 80 to 100 million
- Percentage of eligible voters who cast a ballot in the 2012 presidential elections: 53.6 percent
- Percentage who turned out in 2014 elections: 36.4 percent
- Last time turnout was that low: 1942
Voting Restrictions and Fraud
- Number of states with new voting restrictions, including limitations on voter registration, in place for the 2016 election: 14
- Percentage of voters unaware their state requires or requests voter ID: 22 percent
- Number of voting places closed down in South following the 2013 Shelby County v. Holder Supreme Court decision weakening the Voting Rights Act: 868+
- From 2000 to 2014, number of cases of impersonation fraud out of a billion ballots: 31
(Sorry Donald, but it’s just not true!) - Number of people who can’t vote because they’ve been convicted of felony-level crimes: 6.1 million
- Number of Americans who can’t vote in the presidential elections because of they live on island territories: 4 million
For some of the reasons reflected in this data, the US ranked the lowest of all other established democracies in a comparison of election standards and procedures conducted by The Electoral Integrity Project (EIP).
US elections got poor grades, the report states, because experts “expressed concern about the quality of the electoral laws, voter registration, the process of drawing district boundaries, as well as regulation of campaign finance.”
We hope Americans will get out and vote today, so we can work on improving these and many other problems affecting our democracy.