Ta-Nehisi Coates’ cover story at The Atlantic, “The Case for Reparations,” published last night — and the subject of this week’s Moyers & Company interview — shows how dramatically the legacy of slavery and centuries of legalized and institutionalized racism have held back our country’s African-American population. In 2014, there still very much exists what in 1967 Martin Luther King described as “two Americas,” one “overflowing with the milk of prosperity and the honey of opportunity,” the other tainted by “a daily ugliness … that constantly transforms the buoyancy of hope into the fatigue of despair.”
Last summer, America celebrated the 50th anniversary of the March on Washington, and this week marks the 50th anniversary of the beginning of President Lyndon Johnson’s Great Society programs. But in 2014, just as in the mid-1960s, which one of Dr. King’s two Americas you live in likely depends on the color of your skin.
These charts show what those two Americas look like.
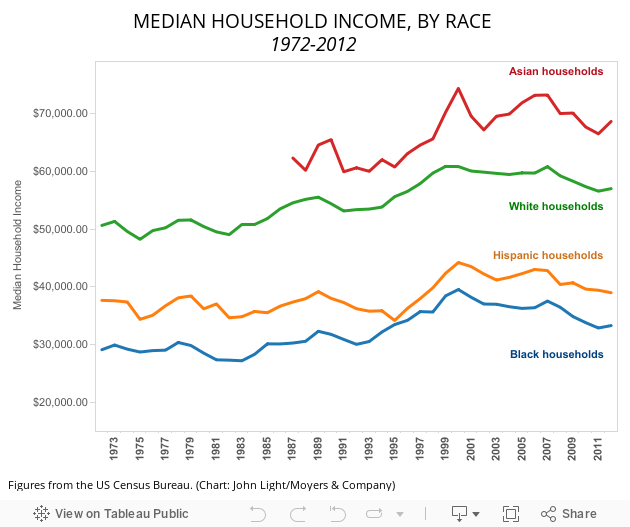
For the last few decades, the median household income for African-Americans has done little to catch up to that of whites. The comparatively low incomes of Hispanic and black households is made worse by the fact that across races, Americans are making less today than they were in the year 2000.
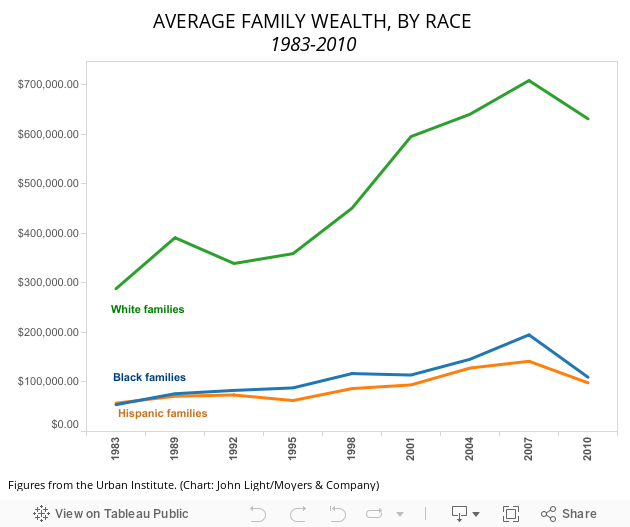
Median household income is just one measure of a given demographic’s economic wellbeing: as the Urban Institute notes, the racial wealth gap is three times greater than the racial income gap. Wealth is a measure of all the money a family has, as well as assets — such as a house. In 1983, for every dollar held by the average black or Hispanic family, the average white family had five. Rather than shrinking, that gap has increased from the 1980s through today; white families now have nearly six times as much as black families.
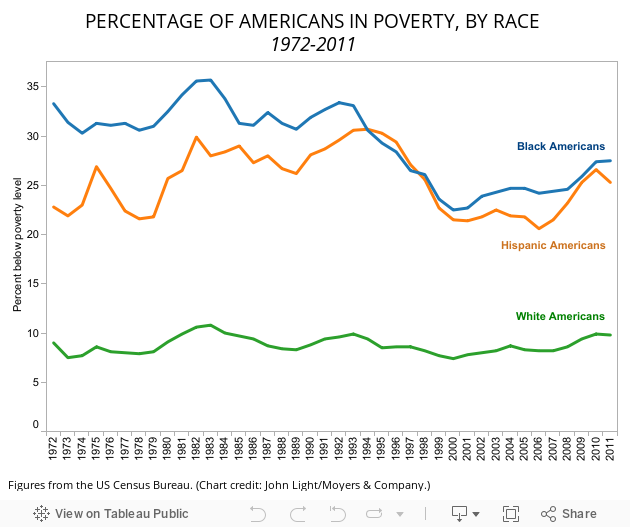
These divides put a far greater proportion of racial minorities below the poverty line than whites. Today, about one in 10 white Americans lives in poverty; compare that with roughly one in four Hispanic-Americans and African-Americans. The Great Recession hit minorities particularly hard, with poverty rising from 24.2 percent to 27.5 percent among African-Americans and 20.6 percent to 25.3 percent among Hispanic-Americans between 2006 and 2011.
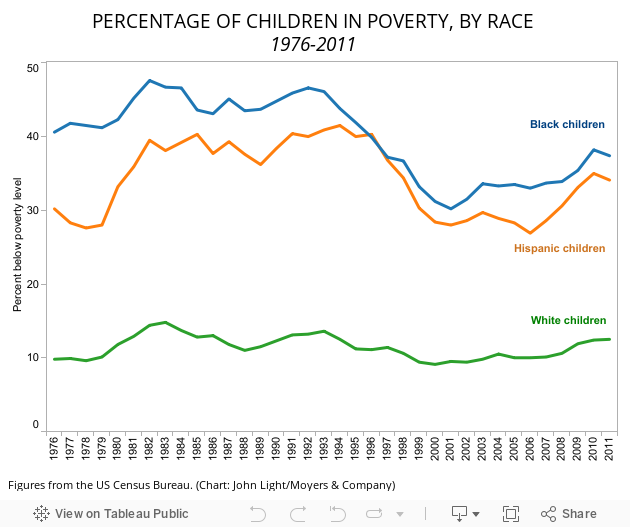
Racial poverty figures are even more stark when you look at child poverty. Across racial demographics, children are more likely to live in poverty than adults. But with racial minorities, the numbers are striking: In 2011, 37.4 percent of black children and 34.1 percent of Latino children lived in poverty. That’s more than a third of children in both groups. (In 2011, a family of three was in “poverty” if it made less than $18,530 a year.) Compare that with 12.5 percent of white children living in poverty — which is, of course, still a depressingly high figure.
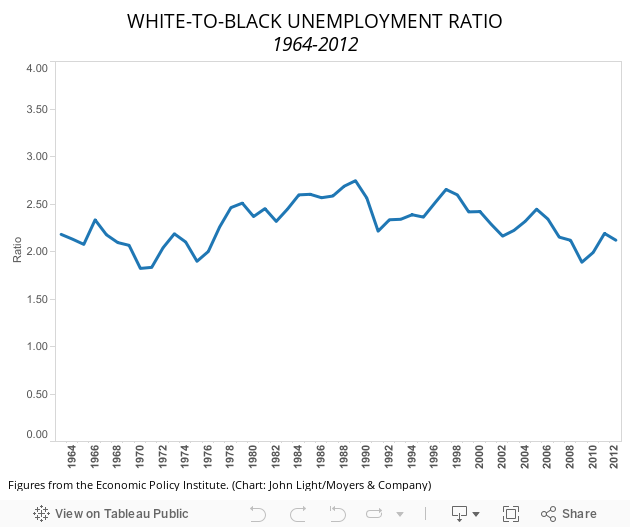
Research by the Economic Policy Institute, a labor-oriented think tank, shows one of the drivers of the yawning inequalities in the charts above: The unemployment rate among black Americans has remained at least twice as high as that of white Americans for 50 years. Back in 1963, the unemployment rate was 5 percent for whites and 10.9 percent for blacks — or 2.2 times as high for blacks as for whites. In 2012, it was 2.1 times as high (6.6 percent for whites, 14 percent for African-Americans) after 50 years of fluctuating more or less between 2 and 2.5 times as high.
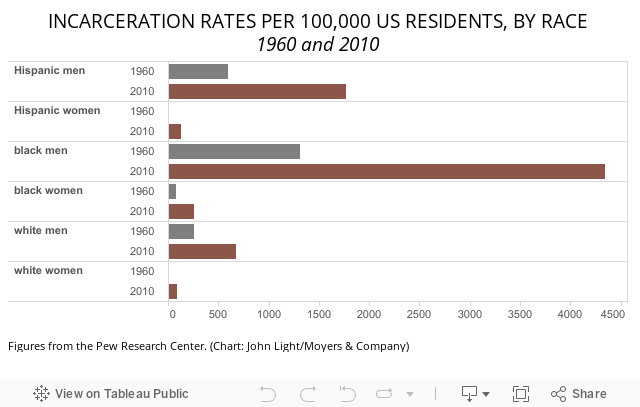
The structural racism behind these economic disparities takes many forms; some can be quantified, and some cannot. One that can is the rate of incarceration.
Across races, a greater share of Americans are imprisoned today than 50 years ago. But the increase has been more dramatic among African-Americans. For every one white man out of 100,000 imprisoned in 1960, 2.6 are imprisoned today. For every one black man out of 100,000 imprisoned in 1960, 3.3 are imprisoned today. Even though, in 1960, there were still US states maintaining “separate but equal” schools, disenfranchising African-Americans and barring interracial marriage, a larger share of the black population is behind bars today. According to the Pew Research Center, for every white man in prison in 2010, 6.4 black men were in prison.
(This, argue many, is the legacy of the War on Drugs. “We have not ended racial caste in America; we have merely redesigned it,” writes Michelle Alexander in her book on the topic, The New Jim Crow: Mass Incarceration in the Age of Colorblindness.)
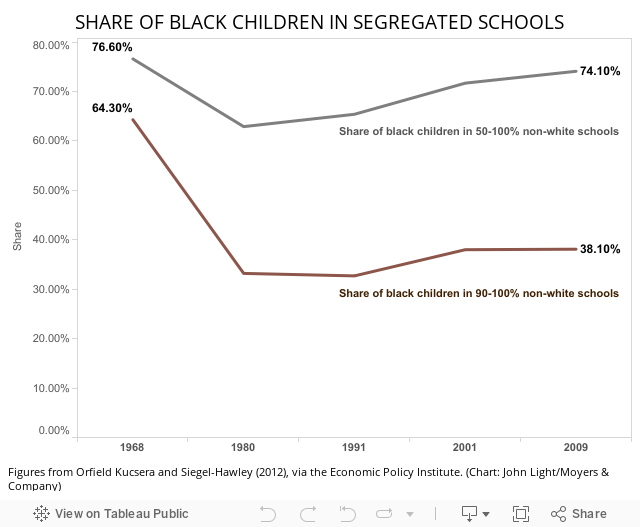
It’s been 60 years since the Supreme Court struck down the concept of “separate but equal” schools in Brown v. Board of Education, but today, the majority of black students attend schools that are majority non-white. The share of black students attending a majority-non-white school today — 74.1 percent — is little changed from figures from the 1960s. Nearly 40 percent of black children attend schools that are almost entirely (more than 90 percent) non-white.

Housing is another form of segregation with centuries of history in America. Today, it is not always so overt as in the past — such as what Ta-Nehisi Coates documents in mid-century Chicago in “The Case for Reparations” — though, of course, housing-related racism is still ugly and overt often enough (see: Donald Sterling).
But it takes insidious, harder-to-document forms too. The chart above shows one of them: Latinos and African-Americans with good credit receive high interest rate mortgages far more often than whites. These mortgages are supposed to go to risky borrowers; because of their higher rates, houses purchased with these mortgages are harder to pay off, and are more likely to be foreclosed on. This phenomenon — giving higher-rate, or subprime, mortgages to families of color who qualified for more traditional mortgages — was one of the reasons why the housing bubble burst, which, in turn, helped set off the global financial crisis.
This phenomenon also helps explain why minorities were hit harder by the Great Recession, and illuminates the modern-day racism that keeps the wealth gap so strikingly wide.