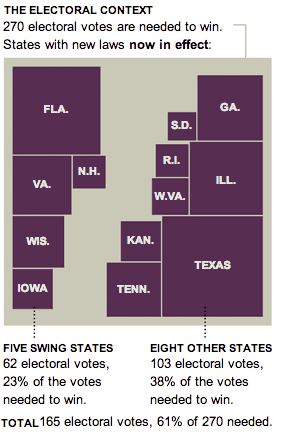
The New York Times has a new infographic map that looks at the electoral power of states in which voter ID laws have been proposed or enacted over the past two years. Rather than using geography, each state is represented by a box — the color of the box denotes the status of the law and the size of the box reflects the proportion of votes the state casts to the electoral college. Five swing states — Florida, Virginia, New Hampshire, Wisconsin and Iowa — have new laws and control 62 electoral votes (or 23 percent of the votes necessary to win).
See the entire map at the Data Points blog on The New York Times.


