Smart Charts
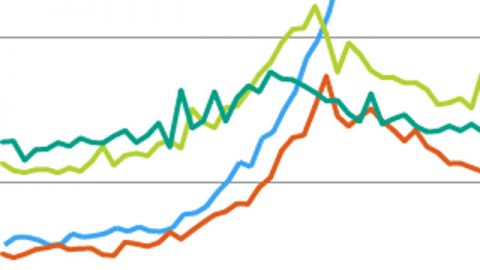 December 24, 2013Corporate profits have rebounded while more than four million Americans have been without work for six months or longer.
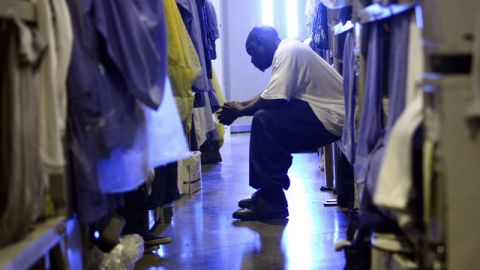 December 20, 2013Mass incarceration has become a form of legalized discrimination that makes it more difficult for millions to participate in basic aspects of our democracy.
 December 13, 2013Forget Congress: The real action after Newtown was in 40 states -- from assault weapon bans to "volunteer emergency security forces" for K-12 schools.
 November 14, 2013A new ACLU report documents the disturbing growth of endless sentences.
 October 11, 2013New research shows the US made greater gains in wealth than any other country, despite record poverty levels and stagnant wages.
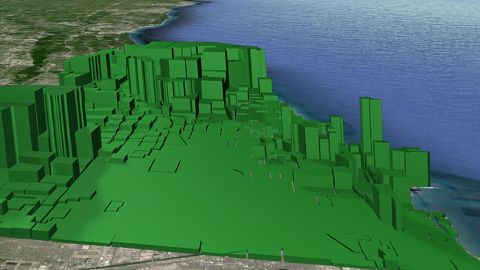 October 10, 2013An artist re-envisions the skylines of major cities to reveal the gap between rich and poor.
 September 20, 2013A snapshot of what America's middle class used to be and what it is now in terms of wages, work and out-of-pocket costs -- and the problems caused by growing economic inequality.
 September 19, 2013If food waste was a country, its 3.3 gigatonnes of emissions would make it the third highest emitting country in the world.
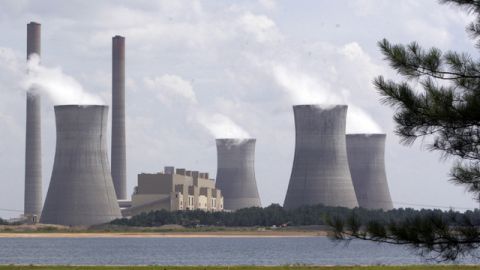 September 18, 2013A handful of very dirty power plants are responsible for a huge share of America's CO2 emissions. We mapped them.
 August 28, 2013A study looked at high-earning CEOs performances over the past 20 years and found that compensation isn't at all reflective of a job well done.


