Census data released this week show that after yet another year of anemic “recovery,” the number of Americans living in poverty last year remained stubbornly unchanged.
But what is “poverty” as measured by the federal government? Experts argue that the official measure is outdated, and doesn’t take important economic realities into account. Are those with incomes slightly above the poverty threshhold not “poor people,” as most of us would understand it?
In 1999, a single mother struggling with this question sent an email to the Health and Human Services employee whose job it was to calculate the federal poverty line. She wrote:
I am a single Mother and work two jobs which equal about $18,000 per year. We barely afford rent, electric, cable, phone, water, food, taxes and vehicle expenses. [But] the federal poverty level is $11,060. My daughter and I have zero, no, zilch money left after paying the bills for medical or clothing. How on earth does the Federal Government expect us to pay for cars….There just is NOT enough money left at the end of the month for a car payment….Please tell me…how they expect people to live on under $20,000 per year.
The poverty line in the email, $11,060, was the federal poverty guideline in 1999 for a family of two. Today, that figure is $15,510 — still less than what the woman was struggling to get by at the time.
That raises a crucial question: why is the federal poverty cutoff so far off?
Origins of the poverty measure
From the early 1980s until last September, the Health and Human Services employee responsible for responding to that frustrated mother and others like her was Gordon M. Fisher. Fisher worked in the Office of the Assistant Secretary for Planning and Evaluation, where his job was to calculate the poverty guidelines — commonly referred to as the “poverty line,” used to determine benefit program eligibility — and to answer questions from the public.

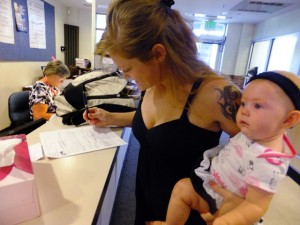
Laura Fritz, 27, fills out a form at the Jefferson Action Center, an assistance center in the Denver suburb of Lakewood. Fritz grew up in the Denver suburbs in a solidly middle class family, but she and her boyfriend, who has struggled to find work, are now relying on government assistance to cover food and $650 rent for their family. (AP Photo/Kristen Wyatt)
“I was a civil servant, not a policymaker. I had to describe the policy — the level of the poverty line — that existed,” Fisher told Moyers & Company. “Although the people wanted that policy changed, I, as a civil servant, did not have authority to change it. At the same time, since they were members of the public, and I was a public servant, I wanted to respond to them with respect. There was not necessarily a good answer to their questions.”
When people called or — later in his career — emailed Fisher saying they were earning wages equal to the poverty line, or more, and still couldn’t get by, he “dealt with it very carefully,” he says. “When something like that becomes official policy, it can become difficult to change. When the people said, ‘I’m making more than that and I still can’t make ends meet,’ sometimes the only thing that I could say was ‘I can’t disagree with you, sir.’ or ‘I can’t disagree with you, ma’am.'”
Looking to more fully answer the questions put to him, Fisher went back to take a look at where the guidelines came from to begin with. “I found that there wasn’t a single good, detailed source on how the poverty thresholds were developed,” he says. So he took it upon himself to document it. “I made that sort of my second job in addition to my day job of putting out the poverty guidelines,” he said. Fisher became known by colleagues as the “unofficial” historian of America’s poverty measures.
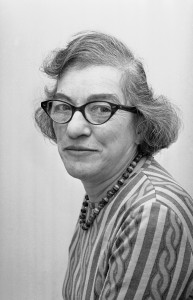
The answer took him back to the mid-1960s, when Mollie Orshansky, a civil servant working for the Social Security Administration, needed to devise a way of measuring child poverty.
Orshansky herself had grown up poor, one of seven daughters born to a family of Jewish immigrants living in the South Bronx. She remembered waiting in food lines with her mother and how her family would decide to forgo important purchases in order to make the rent. In 1970, she told the New York Post, “If I write about the poor, I don’t need a good imagination — I have a good memory.”
Orshansky worked as a government clerk and civil servant most of her life, starting at New York City’s Department of Health. By 1963, Orshansky was working for the Social Security Administration — the agency that oversees many social safety net programs — and was assigned to report on “poverty as it affects children.” But her team had no good measure of what constituted poverty — so Orshansky decided to develop her own.
She used a 1955 Department of Agriculture report which found that families of three or more spent about one third of their after-tax income on food. So, to calculate a poverty line Orshanksy decided to multiply a low-income household’s food budget by three, figuring that if a family was tightening its belt, it would cut all expenses by about the same amount, proportionately.
For the food budget itself, Orshansky used the Department of Agriculture’s “economy food plan.” It was the cheapest of four plans developed by the Department of Agriculture, and was designed to reflect what a family living for a short period of time on a severely constrained budget might need to get by. In 1962, it allotted $18.60 a week for a family of four with two school-aged children — or $143.47 in today’s dollars. It was even less costly than two other “low cost” plans the department had developed, and, as a 1962 report explained, “relie[d] heavily on the cereals, dry beans, peas, and nuts and potato groups, and on the selection of the less expensive items in each of the 11 food groups.” It was only for “emergency use,” and not intended to constitute a family’s diet over the long-term. In a 1965 article, Orshansky said her threshold, dependent on this budget, should be used to measure when a family had “inadequate” funds, not adequate funds.
Her new standard came at a fortuitous time. The Johnson administration had declared a “war on poverty,” and public agencies needed a way to measure the extent of the problem. In 1965, the Office of Economic Opportunity adopted Orshansky’s thresholds as their poverty cut-off, and in 1969, her thresholds were made the government’s official definition of poverty.
Also in 1969, a review committee made up of representatives from many government agencies decided the thresholds would be indexed to the Consumer Price Index, not to changes in the cost of food or the share of a family’s income spent on food. Since that time, the method for calculating the poverty thresholds has changed little.
The poverty measure today
America, however, has changed quite a bit since 1969 — and has changed even more since the mid-1950s, when the USDA budget Orshansky used for her thresholds was designed.
The share of a family’s income spent on food has changed dramatically — some recent studies place the share of a family’s income spent on food as low as six or seven percent of total household expenditures. That would mean Americans today are spending roughly 1/14th of their income on food, compared with the one-third figure used to calculate the poverty guidelines.
“A lot has happened to society and to families needs,” says Arloc Sherman, a senior researcher with the Center for Budget and Policy Priorities. “Fewer people needed to drive to work — you could walk to work. People didn’t need to save the same for childcare, or for college. People could get away without having a telephone and still have a successful job search. It was just a very different world.
“The rise in families with children where all parents are working for pay is driving up the importance of paid childcare. Spending a few thousand dollars on childcare is fairly typical now. Childcare costs have risen faster than inflation. Healthcare spending is a growing part of family budgets just like it’s a growing part of the national economy.
“The fact that other basic needs have increased in cost more rapidly than food is one reason why the old poverty line is out-of-date and, in fact, is too low: It hasn’t kept up with our new necessities, it hasn’t kept up with new ideas of what our basic needs are.”
And the line doesn’t just omit key expenses — because it looks at a family’s before-tax cash income, it also ignores important sources of non-cash income for poor people such as the Supplemental Nutrition Assistance Program (SNAP, or food stamps) and the Earned Income Tax Credit (EITC). If the poverty guidelines don’t incorporate income from benefits, it’s hard to measure if these benefits programs are doing their job and lifting people out of poverty.
“This is relevant right now because there are bills moving through Congress that would cut SNAP by tens of billions of dollars over the coming decade,” says Sherman. “And if you don’t know that SNAP is helping people, you’re more likely to say it doesn’t work.”
Alternate measures
“I think there’s a lot of great work going on, often in nonprofits. I think one of the challenges is the official poverty measure is still there and it ends up dominating the debate and confusing people and getting in the way, and that’s really unfortunate,” says Fremstad.
Moyers and Company has recently used a different threshold for a reasonable standard of living, calculated by the nonprofit group Wider Opportunities for Women. Their Basic Economic Security Tables, or BEST index, takes into account expenses that the federal poverty line doesn’t, including housing, utilities, child care, transportation, health care, household goods, emergency and retirement savings and taxes, and recognizes that each expense is different depending on the location in question. Across America, the BEST index comes in at two to three times the poverty level — and in some cities, even more. The Economic Policy Institute has done similar research, and has a family budget calculator that you can use to find out how much it costs a family to live in every American city.
Anti-poverty advocates have also praised the U.S. Census for recently implementing a second measure of poverty, called the supplemental poverty measure, which, Sherman explains, “makes several changes. It counts those missing tax credits and non-tax benefits as income. It subtracts necessary, work-related expenses, such as childcare, and out-of-pocket medical expenses from income. It counts boyfriends, girlfriends, unmarried partners as part of the family. It adjusts the poverty line for local variations in cost of living, particularly in housing costs. And it uses a poverty line that is in other ways slightly updated from the old poverty line.” The regular measures yielded 46.2 million people living in poverty in America in 2011, but the supplemental measures yielded 49.7 million, many of them elderly.
A new measure?
Right now, many of those who study poverty are not overly hopeful that the U.S. will implement a new poverty measure in the near future. It’s a difficult topic, especially in today’s fraught political environment. Conservatives argue that the measures cover too many people, including many who are lifted out of poverty by government programs like the EITC. Liberals argue that the poverty measures don’t take expenses into account realistically.
Those who work with the U.S. poverty line often look to the U.K.’s system of measurement as an alternative model the U.S. might follow. There, federal agencies use multiple measures of poverty to create policy.
“It would be good for both the left and the right to say, ‘There is no single best way.’ And maybe we could adopt sort of a suite of measures along the U.K. line,” says Fremstad. “And some of those could be more conservative, more absolute, and some of them could be more relative, more liberal. And then we could argue about which ones are the best. But at least we’d have a few — three or four measures that were all good, that Census and the federal government put out and that narrowed the debate.”
Even before her long career researching American poverty ended with her retirement in 1982, Orshansky was unsettled to see her poverty measure become outdated, but remain as federal policy. In 1969 — the year the poverty measure was adopted nationwide and tied to inflation — she expressed skepticism about its implementation. “The best you can say for the measure is that at a time when it seemed useful, it was there,” she wrote.


