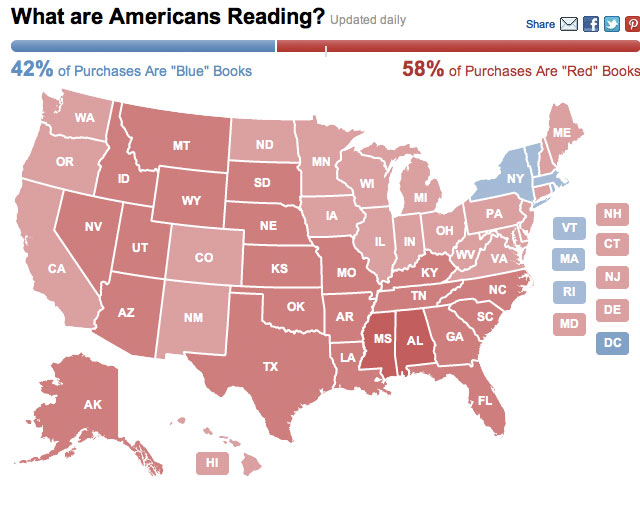
Earlier this month, Amazon.com posted a “heat map” that tracks the political books Americans are buying on their site. It’s updated daily. They say the map is a “novel way” to track political conversation in the run-up to November’s election.
On Amazon.com’s map page, you can also select individual states to see the percentage of “red” and “blue” books sold over the past 30 days. As you can see from the map above, red books are doing very well in every part of the country except the Northeast.


