Today’s jobs numbers — 115,000 new jobs in April — are causing some to worry our recovery may be softening. Mitt Romney pounced on the numbers this morning, calling them “very, very disappointing” on several networks.
“We should be seeing numbers in the 500,000 jobs created per month,” Mr. Romney said. “This is way, way, way off from what should happen in a normal recovery.”
Media that Matters contextualizes Romney’s ambition by noting that 500,000 jobs growth in a month has only happened “five times since the end of the Eisenhower administration: March 1978, April 1978, September 1983, September 1997, and May 2010” — and a “grand total of 16 times in US history.”
To put that in perspective, monthly job growth that exceeds 500,000 happens with roughly the same frequency as perfect games in baseball, of which there have been 19 since 1900. (Not an exact comparison, of course, but it illustrates the infrequency.)
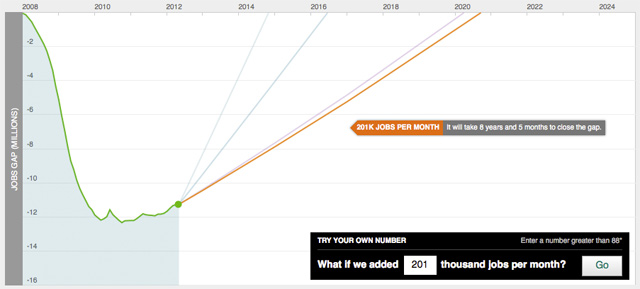
Washington Post reporter Brad Plumer explains that because monthly jobs numbers are “noisy” — and often adjusted after the fact — economists prefer to use quarterly averages. For this year’s first quarter, that works out to be 201,000 new jobs per month. Plumer puts that number in perspective by pointing out that it’s about the same pace as the best year during the 2000s (namely, 2005).
But what does all this mean in terms of closing the jobs gap and getting back to pre-recession unemployment figures?
The Hamilton Project’s handy interactive tool allows you to plug in any jobs-created-per-month number and see how long it would take to close the gap. (via Washington Post) We plugged in 201,000 — the projection is nearly 8.5 years. Try it yourself.


