Families search through shoes donated by Crocs at a distribution site for Feed The Children on May 9, 2009 in Hoffman Estates, Illinois. Six tractor-trailers filled with food, personal care items and shoes were distributed to area families in need by the organization. Feed The Children is an international, relief organization that used truck caravans to help communities in the US that were hard hit by the current economic crisis. (Photo by Scott Olson/Getty Images)
This post originally appeared at Talk Poverty.
When political scientists Jacob Hacker and Paul Pierson released Winner-Take-All Politics in March 2011, it made headlines. The book’s vivid descriptions of how moneyed interests had come to dominate the Washington political scene captured media attention and helped shape conversations around public policies affecting economic inequality.
But while Winner-Take-All Politics got a lot of attention, the media missed a crucial part of the book: Rising inequality comes at a high cost to individual workers. In the book, Hacker and Pierson presented calculations showing that if inequality had stayed constant from 1979 to 2006, the bottom 90 percent of Americans would make up to 36 percent more per year than they currently do.
Half a decade later, inequality is still growing. It also still isn’t getting the media attention it deserves, even though it’s making a massive impact on Americans’ lives. It’s like climate change: There is nothing “new” about growing inequality, so it gets pushed out of the news in favor of White House scandals and presidential tweets. But just like global warming, economic inequality is slowly but surely destroying the livelihoods of many Americans.
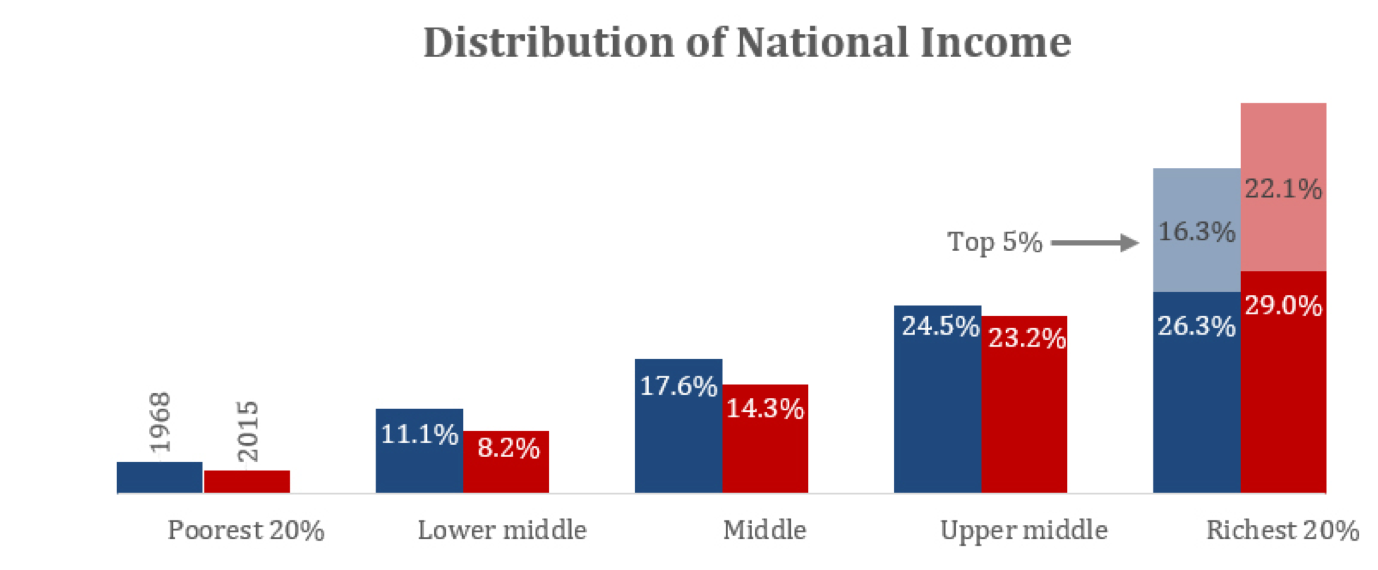
You can see this quite clearly when you look at how the distribution of household income has changed over the past 50 years. I extended Hacker and Pierson’s original calculations to include incomes from 1968 to 2015, giving us about two decades’ worth of additional data beyond other recent calculations. The wider timeframe shows an even deeper decline in income than the authors originally reported.
The table below breaks this down by income bracket. The second column shows what each group’s average household income was in 2015; the third column shows what the group’s average income would have been if inequality had stayed the same between 1968 and 2015.
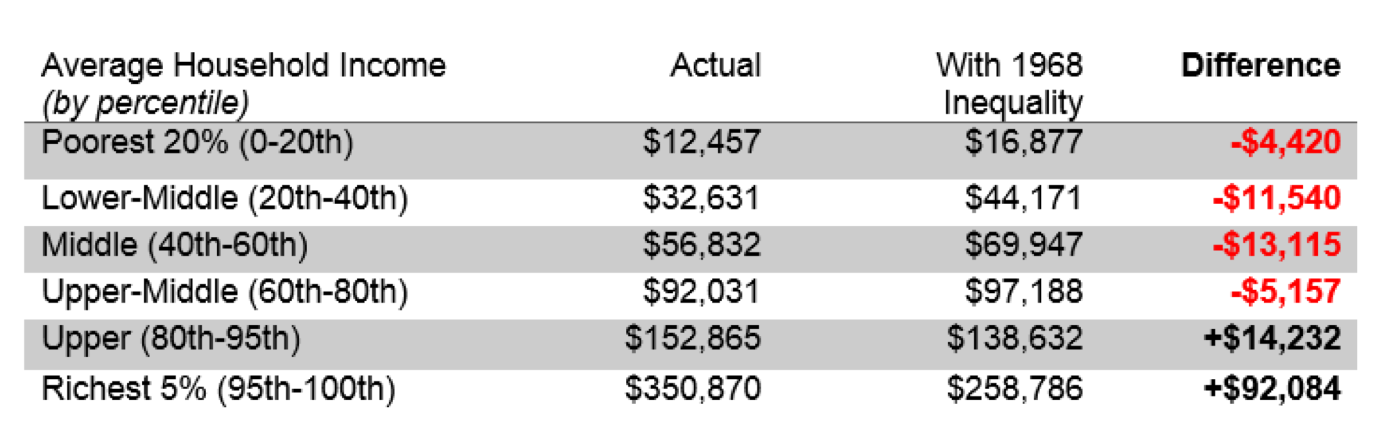
Source: Author’s calculations based on 2016 data from the US Census Bureau.
If it weren’t for the increase in inequality, the bottom 40 percent of households would be making more than 35 percent more today.
The gains, of course, have gone to the very wealthiest Americans — especially those in the top 5 percent. Due to the rise in inequality, higher-income — those in the top 20 percent of the income distribution but not in the top 5 percent — have seen a 9 percent increase in their annual incomes. But incomes for households in the top 5 percent are 26 percent higher — an increase nearly three times as great. This reveals something important about the nature of rising inequality: The “winners” from increased inequality are really a small group of incredibly rich Americans, who are taking increasingly large shares of the total national income.
The findings are pretty difficult to refute. Conservatives have long argued that household income statistics are unreliable because they fail to account for differences in household size. But the increase in inequality appears just as real even when we look at “equivalence-adjusted income shares,” which control for differences in household size and composition.
In fact, the figure below shows that households in the bottom 40 percent of the income distribution have actually seen their share of national income decline more when we use the equivalence-adjusted household income that addresses conservatives’ concerns.
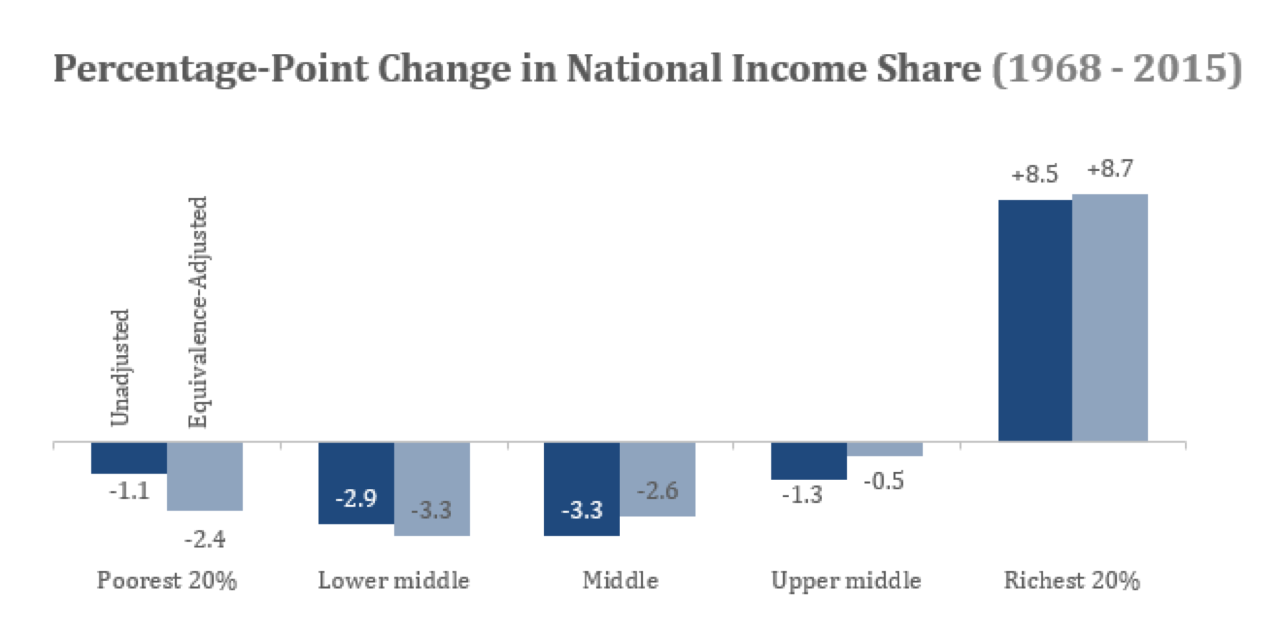
The poorest fifth of households saw their share of national income decline from 4.2 percent in 1968 to 3.1 percent in 2015, a drop of 1.1 percentage points. However, if we instead look at equivalence-adjusted income, their share of the national income dropped more than twice as much (from 5.8 percent to 3.4 percent, a drop of 2.4 percentage points). Conservatives are right to say that normal household income statistics can be misleading; but that’s because the normal statistics under state the rise in inequality, not because they overstate it.
The rise in inequality is no statistical mirage. It is undoubtedly real — and its effects have been pernicious. Our country’s poorest households lose more than $4,000 every year as a result of the growth in inequality; lower-income families lose more than $11,000; and middle-class families lose around $13,000. That money could pay for real things that families have to do without, whether it’s better food or new shoes, a trip to the doctor or a great summer camp.
If the rise of economic inequality is going to be the great untold story of our time, then reducing inequality should be the greatest progressive objective of the 21st century.