
This post first appeared at OpenSecrets blog.
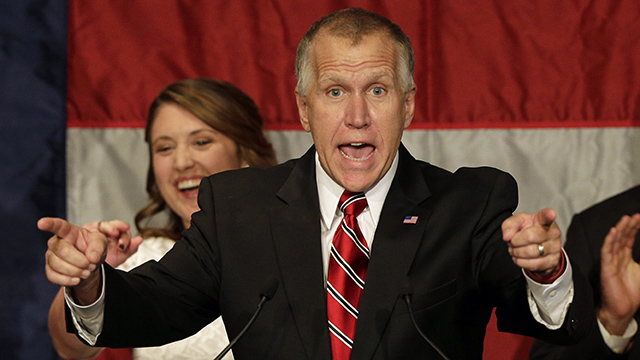
Republican Senate candidate and North Carolina House Speaker Thom Tillis speaks to supporters at an election night rally in Charlotte, NC, Wednesday, Nov. 5, 2014, after defeating Democratic Sen. Kay Hagan. (Photo by Chuck Burton/AP)
Republicans made the most of their fundraising advantage and routed Democrats in Tuesday’s midterms, but they seized the majority in the Senate and built their lead in the House even as fewer donors participated in the process and more of the dollars came from secret sources.
Democrats weren’t swamped when it came to the money game, but the GOP clearly had the upper hand. Even where Democrats had raised more in pivotal Senate races, though, they still were mostly beaten. Several key differences between the two sides emerged on the fundraising front, with Democrats increasing their reliance on small donors since 2010 while Republicans turned sharply to big dollar donors.
The real story of the election’s campaign finance chapter was not which side had more resources, but that such a large chunk of the cost was paid for by a small group of ultra-wealthy donors using outside groups to bury voters with an avalanche of spending. Both sides had plenty of support from outside spenders, but Republican and conservative outside groups outpaced the spending of Democratic and liberal ones. Democratic/liberal groups channeled most of their money through organizations that disclosed donors, while their more conservative counterparts relied heavily on secret sources funneling money through political nonprofits.
Some things seem never to change, and this year’s midterms reprised many of the same old stories. But there were also a handful of surprises, some of which may portend new dynamics in how elections are financed.
Every election since 1998 has been more expensive than the one before it, and predictably the 2014 election will follow that path, CRP has projected — though the total projected cost of $3.67 billion is only a slight uptick over the price tag of the 2010 midterm. Counting all forms of spending — by candidates, parties and outside groups — Team Red is projected to have spent $1.75 billion, while Team Blue’s spending is projected to ring in at $1.64 billion.
CRP’s analysis of Tuesday’s results finds that in House races, the candidate who spent the most prevailed 94.2 percent of the time; the Senate figure is slightly lower, 81.8 percent. Despite several key upsets of Senate Democrats who, as incumbents, had the cash advantage, this is actually an increase from 2012, when 93.8 percent of higher-spending candidates in the House won, and just 75.8 percent of those candidates in the Senate could claim victory.
(Graph: OpenSecrets.org)
None of those trends are new or terribly surprising.
What is different is the apparent decline in the number of donors. Just as every election since 1998 has been more expensive than the last comparable one, every election also saw more donors than the one before. It appears the 2014 election will break that chain, with a smaller number of overall individual donors. And the campaigns themselves are projected to spend less money than in the previous election: In 2010, they spent $1.8 billion, and this cycle they are projected to lay out $1.5 billion.
Of the money raised by Senate and House campaigns, CRP’s analysis shows, the bulk still came from individual donors (as opposed to PACs), but Republicans dramatically reduced their reliance on donors who gave $200 or less, while Democrats leaned on them slightly more than in 2010.
One striking development: The cost of the average winning campaign in both the House and Senate declined, as measured by the money spent by the candidates themselves — even as the total cost of the election increased. The average winning House campaign cost $1.2 million, down from $1.5 million in 2012. And the average winning Senate campaign cost $8.6 million, down from $11.4 million in 2012 — even with several Senate races setting records for their final price tag. One reason: Outside groups did some of the heavy lifting, outspending the candidates in 36 races. That’s a new dynamic in elections: These groups — dozens of them devoted to a single candidate — are increasingly buying ads, getting out the vote, doing opposition research and taking on other activities that have usually been up to campaigns to execute.
Records topple
Before all the ballots were counted and final disclosures made, numerous races had shattered previous records for spending. In races that were competitive, the spending was explosive.

Democratic Sen. Kay Hagan’s race was the most expensive in history. (Photo by Gerry Broome/AP)
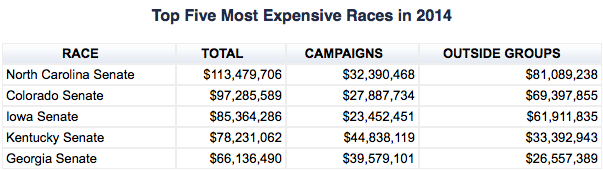
Reported outside spending in the Hagan-Tillis faceoff totaled $81.2 million, shattering the previous $52.4 million record set in the 2012 Virginia Senate race. Two other Senate races this year also bested that earlier record: Colorado ($69.2 million) and Iowa ($61.7 million).
Outside groups are projected to account for 13 percent of this year’s election cost, while the total amount paid for by candidates, PACs and parties is projected to decrease compared with the last midterm election, from $2.9 billion in 2010 to $2.7 billion this cycle.
Prior to the 2010 Citizens United Supreme Court decision, and even in the first elections following that ruling, the race in which the candidates spent the most always claimed the title of most expensive.
No longer. For example, in 2012, the Massachusetts Senate race was the most expensive, costing $84.4 million, of which candidates accounted for $77.2 million. This year, in North Carolina’s record-breaking contest, the two main candidates spent just $32.3 million of the total $113.3 million cost.
Using the old measure of candidate spending, Kentucky’s Senate race was the most expensive. GOP Senate Minority Leader Mitch McConnell and Democrat Alison Grimes combined to spend $40.3 million.
While the campaigns of the Democratic senators from North Carolina and Colorado heavily outspent their Republican challengers, they were defeated decisively, handing rare losses to more moneyed incumbents.
Outside spending not determinative; questions remain
In terms of reported spending, outside groups that either supported Hagan or attacked Tillis spent $37.2 million, besting the $33.1 million spent on the other side. But Americans for Prosperity — a 501(c)(4) dark money group — alone claimed to have spent at least $9 million on “issue ads” targeting Hagan that never had to be disclosed. That suggests Team Blue was outspent in North Carolina. But how much AFP spent in that state isn’t known for sure, and that — along with the possibility other groups, conservative or liberal, might have also spent large unreported sums – might make it impossible to ever settle the question.
Overall, the amount of unreported spending by outside groups almost certainly exceeds $100 million according to the Wesleyan Media Project and others.

Sen. Mitch McConnell (R-KY) saw far more outside spending on his behalf than his Democratic opponent, Alison Lundergan Grimes, did. (Photo by J. Scott Applewhite/AP)
Still, just as a narrative begins to emerge again, another race seems to disrupt the pattern. In New Hampshire, where Democratic incumbent Sen. Jeanne Shaheen won, Team Blue’s outside groups reported outlays of $11.9 million — less than Team Red’s outside groups, which spent $13.4 million.
Dark Money
While spending by all outside groups is up, the expenditures by groups that do not disclose some or all of their donors is up most sharply. In 2010, these groups reported spending spent $160.8 million, a figure that jumped to at least $215.6 million this cycle.
And of the $219 million spent by outside groups that are partially or completely nondisclosing this cycle, 69 percent of it has been spent by Team Red.
The race that attracted the largest share of this money was the Colorado Senate contest, which saw $22 million in reported outside outside spending by groups that disclose no donors and $5.3 million from groups that disclose some donors. Outside money spent by fully disclosing groups totaled roughly $27.9 million.
On the House side, Arizona’s 1st Congressional District, where incumbent Democratic Rep. Ann Kirkpatrick squared off against challenger Andy Tobin, attracted the most outside spending by nondisclosing groups — $2.5 million. The bulk of that came from two conservative dark money groups — American Action Network and Young Guns Network — which combined to spend a reported $1.6 million, or significantly more than the $1.1 million reported spent by the Tobin’s campaign that both groups supported.
The McCutcheon factor
In April, the US Supreme Court issued its latest important campaign finance decision, tossing aside the overall $123,200 cap on how much individuals can give to candidates, PACs and parties in one election cycle (the limit did not apply to donations to super PACs or other outside spending groups). When the ruling in McCutcheon v. FEC was handed down, many campaign finance observers predicted that it would empower a new class of elite donors and lead to the creation of massive joint fundraising committees — teams of candidates, party committees and other groups that could pursue big donors together and split the proceeds of a single giant check.
Both of those things occurred in 2014.
Besides outside groups picking up a larger portion of the election tab, the rise of the post-McCutcheon ultra-donor is likely a contributing factor in explaining the lower numbers of individual donors. There were 498 of these donors – individuals who gave more than the pre-McCutcheon limits would have permitted.
At last count, the No. 1 hard-money donor this cycle was Elloine Clark of Dallas, Texas, the widow of attorney William H. Clark. Clark gave $442,766 this cycle. All of her donations that went to recipients with a partisan affiliation went to Republicans. She was followed by Tatnall Hillman, of Chilmark, Massachusetts, who gave $403,659; again, all of her recipients that could be characterized with a party label were Republicans.
Big Democratic donors lagged behind in this category — seven of the top 10 hard money donors gave overwhelmingly or completely to Republicans — but were equally partisan. The third largest hard money donor was Marsha Z. Laufer, who gave $398,500, all to Democrats.
The enormous sum of cash generated by these elite donors is hard to overstate. The top five alone combined to give $1.9 million, or the same amount as 16 maxed-out donors under the pre-McCutcheon limits. For context, that’s far more than the average winning House race cost this year ($1.2 million).
As for the joint fundraising committees that enabled many of these ultra-donors to give large sums in one fell swoop, they also had a banner year.
These JFCs are not a new concept; they’ve been especially popular in presidential years, when each party’s nominee teams up with party committees to hit large donors and then divvy the spoils. But this cycle, despite it being a midterm, brought a record number of active JFCs — 509, compared to 473 in 2012 and 370 in 2010. Together they raised $168.7 million, more than in any other midterm.
Number of Individual Donors
In every midterm election since 1990 (as well as in every presidential), the total number of individual donors has increased along with the total cost. This time, CRP has projected the total cost of election will rise, but, for the first time in 24 years, the total number of reported donors will likely decline.
As of mid-October, there were at least 666,773 donors individuals who gave more than $200 this cycle — substantially fewer than the 817,464 in 2010.

(Graph: OpenSecrets.org)
Small donors (giving $200 or less) were a bigger part of Democratic fundraising than they were in 2010, though not by much. Their share of the Republican fundraising pie shrank substantially, however.
In 2010, all Democratic recipients (including campaigns, party organizations and some PACs) raised $205.2 million from small donors, or about 25 percent of their total take from individual donors. In 2014, they have raised $205.3 million, only slightly more — but since total receipts from individual donors fell, the share increased to 28 percent.
On the other hand, in 2010, Republican recipients raised $212.8 million from small donors, which accounted for 36.3 percent of their fundraising from individuals. But in 2014, GOP recipients have picked up only $150.7 million from these small-dollar contributors, or just 26.3 percent of their total.
On average, Democratic House candidates in the 2014 general election have raised $89,194 from donors of $200 or less, 9.4 percent of the average total from individuals. That’s down from the average of $106,494 in 2010, but up, percentage-wise, from 8.8 percent that cycle. House GOP candidates raised on average slightly less than their Democratic opponents this cycle — $85,118 — but that’s a serious decline from 2010, when their average was $153,209. The 2014 number also a much smaller piece of the GOP House fundraising picture, going from 13.8 percent of the average amount a Republican House candidate raised from individuals in 2010 to 7.3 percent this cycle.
On average, Democratic Senate candidates have raised more money from small donors in 2014 than they did in 2010 — $1.45 million this cycle compared to $923,000 in 2010 — and their reliance on small donors has increased as well. Small donors accounted for 12.2 percent of these candidates’ average intake from individuals in 2010, and 17.2 percent in 2014. Meanwhile, the amount raised on average by Republican Senate candidates from small contributors has dropped precipitously — from $1.6 million (or 16.3 percent of the total from individuals) in 2010, to just $508,275 (or 8.1 percent) in 2014.
